We’ve mentioned before that much of the literature on affordable housing and affirmatively furthering fair housing focuses on major metropolitan areas and their urban demographics. We’re not immune to all those gnarly issues here in Vermont, but we can’t help but wish for more analysis with a rural focus.
Help may be on the way from HUD, via its Affirmatively Furthering Fair Housing Tool, which promises to provide maps, housing and demographic data for jurisdictions in all parts of the country, including the rural ones. We say “promises” because we can’t seem to get the tool, which is still in development but available for interim inspection, to work for Burlington or the rest of Vermont — the two jurisdictional options. The mapping tool does work on our desktop for New Hampshire and Maine, so it’s possible to get an idea of what sorts of data plots we’ll be able to see for Vermont one of these days.
You can try your luck by clicking here. Then click OK, choose one of the 12 maps you’d like to see (e.g., race/ethnicity, housing choice vouchers, demographics and transportation, etc.), then the state and jurisdiction. If you can get it to work for Vermont, great; if not, choose another place just to get an idea.
When this system is fully functional, it will be accessible to anyone and perhaps will spare HUD grantees the expense of hiring consultants to do the requisite fair-housing analysis.
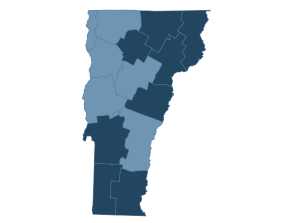
Meanwhile, rural places like Vermont do have another helpful data source, the Housing Assistance Council, which provides interactive maps with data on the state and county level. Here’s what the Vermont map looks like:
The darker counties have higher poverty rates. We don’t know how to make the map interactive on this blog, so click here to explore it on the Council’s website. You can click on each county for a wealth of data. You’ll notice that the rural percentage of each county’s population is listed – 100 percent, in most cases, 0 percent in Chittenden County, our very own megalopolis.


