Category Archives: Uncategorized

A notable anniversary

Fifty years ago today, President Johnson signed the Voting Rights Act.

lbjsignsvra

This was the second major piece of civil rights legislation of his presidency. The third, of course, is known as the Fair Housing Act of 1968.

Click here for a video of LBJ’s stirring remarks on the day of the signing, delivered apparently in the Capitol rotunda.  Faces in the crowd include Dr. Martin Luther King Jr.

Brief respite from drought/wildfire news

An interesting story in the UC-Berkeley student newspaper touches on several themes of interest. Yes, it’s alien territory – high-rent California, urban beyond our rustic imagination (Alameda County alone, home to Berkeley and Oakland, has 2 ½ times the population of the entire state of Vermont).

Still, there’s resonant material here:

  • A university food-service worker who can’t afford to live in the town where she works, Berkeley, and who thus must endure a long commute. She pays a mere $1,400 for a 2BR apartment in Richmond (hey, at $700 a bedroom, that’s about the going rate in Burlington!). Berkeley’s 2BR apartments average about $2,100.   Here’s a shot of a Berkeley “castle.” Not so exotic, really — we can picture a building like this in St. Johnsbury or Rutland.

berkeley1

Chances are, a UC food-service worker makes a good deal more than a UVM food service worker. After all, the University of California recently raised its minimum wage to $15, more than Sodexo pays its line workers in Burlington, and the main beneficiaries were reported to be student employees, apparently because the regulars were already getting at least that much.

So, yes, the numbers are all inflated compared to our world, but the cast of characters is similar: workers who can’t find affordable housing near where they’re employed or where their kids go to school.

  • Berkeley has had some form of inclusionary zoning for nearly 20 years, but it hasn’t done the trick. In fact, the affordable housing shortage has increased. This doesn’t mean inclusionary zoning is worthless. It’s an important policy tool, but it’s not salvation and in many cases produces only a small fraction of the affordable units needed. (Burlington’s total is less than 250 units over 25 years, fewer than 100 of which were rentals).

Here’s another, not-so-picturesque perspective of pricey Berkeley:

berkeley2

  • Simply building more housing isn’t going to solve the affordability problem. So says a housing activist quoted in the stories. Yes, he’s talking about the Bay area, which apparently is pretty well-built out within its topographic limitations. Building new housing there typically means tearing down an existing building and replacing it with something taller and more costly.

We hesitate to draw the same conclusion about Burlington, which likewise is pretty well built out, but which still has plenty of room for in-fill and accessory units. Here, a surfeit of additional rental units might indeed alleviate the upward pressure on rents, but not enough, we suspect, for low-wage workers at our state university.


The 30 percent itch

What’s up with 30 percent? Why is 30 percent the standard benchmark for the share of income that an average household can afford to spend on housing? That figure has been around for decades. Where did the number come from, and is it still appropriate?

thirty

An article in Fortune raises these questions and implies that, well, maybe the threshold should be higher in the 21st century. After all, the 30 percent benchmark dates from the Depression and the long-ago debut of public housing.

Well, it’s always worth questioning shibboleths. The hazard in this case is that raising the benchmark would fall hardest on the people who are already the most squeezed and potentially provide an excuse for cutting their public benefits even further.

Back in 1937, 30 percent was set as the share of income that public housing residents were expected to spend for rent. Today, that’s the share that Section 8 recipients are expected to spend. It’s the share of income that a renter spends for an apartment that’s deemed “affordable.” Apartments that cost more are “unaffordable,” and renters living in unaffordable apartments — that is, people who pay more than 30 percent of income on rent and utilities — are considered “cost burdened.” (In Vermont, that’s 52.5 percent of all renters. Those who pay more than 50 percent are “severely cost burdened – that’s 26 percent of Vermont’s renters, and 12 million of the nation’s households.)

Undeniably, household spending patterns change over time. A study by the Bureau of Labor Statistics of 100 years of consumer spending found that, on average, the percentage of income spent on housing has gone up: From 23 percent in 1900 to27 percent in 1950 to 33 percent in 2002-03. (That’s right, Vermont’s cost-burdened percentage of about 50 percent is close to the national average.) Meanwhile, the share spent on food went down — from 42 percent in 1900 to 13 percent in 2002-03.

The Fortune article argues that we should all expect to be spending a larger share of our income on housing today than back in the Depression. On the other hand, a threshold of roughly 30 percent still means something to mortgage lenders, so maybe it’s not as obsolete as it might look. What’s more, a 2006 Census Bureau study that looked at the history of the 30 percent housing benchmark concluded that it was still appropriate, especially for families of lower incomes.

thirtyb

The fact is that a family with an income $200,000 or more can more easily afford to spend a higher percentage on housing and have plenty left for other necessities. For a family like  that, a housing “burden” is considerably more bearable.


Whither, or whether, the South End

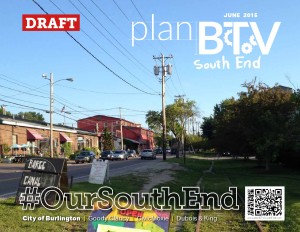
We’d be remiss if we didn’t take note of the Plan BTV South End draft, a colorful 100-page compendium that invites comments through Oct. 1. The draft of course addresses the need for new housing, a controversial subject in the good old South End.

The report’s cover is a nice touch – nothing phony or public-relationsy about it. it’s a workaday portrait with its sandy footpath and telephone poles, warehousey landscape.

00001

That’s all apt, because the South End is nothing if not “funky.” That’s the recurrent adjective assigned to the neighborhood in this document. Just for kicks, we looked up “funky” in the online Urban Dictionary:

  1. Different but cool/nice.
  2. A bad smell.

Plan BTV’s” funky” is presumably of the first definition – akin to the quality Vermonters like to ascribe to their state generally. But no doubt there are irate Burlingtonians who impute the second definition to this draft report and its qualified appeal for housing in the enterprise zone.

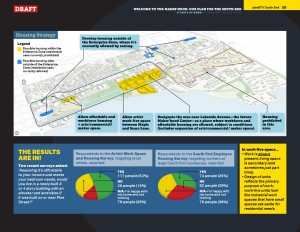
Burlington certainly needs plenty more affordable housing, so why shouldn’t a good share of it be located in the mixed-income South End, given that’s a major employment center (6,300 jobs, according to the report)? The big fears seem to be that more housing will drive up land prices beyond the wherewithal of artists and artisans, and that the housing itself will gentrify the neighborhood.

The report calls for new housing outside the enterprise zone, where housing is already permitted, with affordability stipulations.

000061

New housing inside the zone could take the form of artists being allowed to live in their studios (“work-live units”), with affordability stipulations; or affordable housing units designated specifically for certified artists (an interesting idea, but we’re wondering if there’s precedent for targeting affordable housing to a particular segment of the lower-income population). Either way, artists would have to jump through some not-very-funky hoops to qualify.


Fair housing news from all over

We begin the week with bulletins from unlikely places that nevertheless bear on what this here website is all about…

It seems that lots of people who work in Mount Pleasant (population 75,000) can’t afford to live there. (Sound familiar?) The town has something called a “workforce housing” plan, intended to encourage development of housing that people who make 80-120 percent of the area’s median income can afford, but the plan hasn’t produced much. And now, there’s talk of eliminating the plan’s density bonuses so that even less affordable housing would result.

subdivision2

And this is a region where about half the residents already spend more than half their income on housing. The good news, we suppose, is that the town has a workforce housing plan and density bonuses to begin with. That’s more than can be said for some communities. The challenge – in Mount Pleasant and elsewhere — is to ensure that they actually come to something.

The editorial comes to a conclusion that sounds rather familiar: “The town needs a healthy mix of residents to remain vibrant and prosperous in the future, and those residents – of all income levels – will need a place to live.”

(By the way the Post and Courier won the public-service Pulitzer this year for a series on domestic violence against women – a prize citation that the newspaper reminds us of on its masthead – so, as newspapers go, it’s fairly reputable.)

salem

Since 1969 Massachusetts, to its credit, has had an affordable housing program called Chapter 40B. Chapter 40B permits the overriding of local zoning bylaws to allow affordable housing development in towns where less than 10 percent of the housing stock is affordable.

More than 50,000 units have been developed over the years, statewide. The problem noted by the letter-writer is that some recent projects have been targeted to urban areas that already have their share of affordable housing, rather than to the “leafy suburbs.” The takeaway point here is that a good measure of new affordable housing units should be located in middle-income and upper-middle income areas, not just in the same old places.

  • Lastly, an update on what appears to be the longest-running fair housing case in the country.

Back in 1971, Hamtramck, Mich., was found to have violated civil rights of black residents by razing their neighborhoods as part of urban renewal. The remedy was supposed to be provision of 200 family housing units and 150 senior housing units, we learn from an Associated Press account. Well, it seems that Hamtramck still hasn’t made good, and the judge who presided over the case originally is still determined, at age 93, to see it through.

Here’s hoping that protracted case in Westchester County, N.Y., is resolved sooner.


A small step in the right direction

Inclusionary zoning is getting more and more attention as a planning tool to increase the stock of affordable housing. This is a policy that requires, or encourages, various percentages of housing units in new developments to be “affordable.” The standard of affordability varies, but is typically targeted to people earning 80 percent or less of an area’s median income.

snowysubdivision

While inclusionary zoning has proliferated nationwide – a study last year counted more than 500 programs across the country – it hasn’t exactly taken off in Vermont.

True, inclusionary zoning is typically found in urban areas and larger cities, not in rural expanses. Most of the literature on inclusionary zoning, indeed, focuses on metropolitan settings. A recent example is this one from the National Housing Conference on how inclusionary policies can be made more flexible – with examples from urban settings.

The example routine cited in Vermont is Burlington, which adopted inclusionary zoning in 1990 and which happens to be the state’s largest city.

But in fact, small towns can’t make use of it, too – Davidson, N.C. (population 11,000) and Park City, Utah (8,000) are examples.

And closer to home, there’s Hinesburg (4,400). Hinesburg’s regulations apply to developments of 10 or more units in the village growth area, and call for 10 percent of those units to be affordable. Hinesburg also offers density bonuses, expedited review and other development incentives for projects that include affordable housing.

Now, while inclusionary zoning might seem to be a sensible way to address the affordable housing shortage, it’s hardly a cure-all. In Burlington’s case, for example, inclusionary zoning has resulted in just 200-plus affordable units (rentals and sales) over a quarter-century. That’s barely scratching the surface in a city with nearly 10,000 renting households – more than one-third of whom are severely cost-burdened, that is, spending more than 50 percent of their income on housing and utilities.

Inclusionary zoning does serve the purpose of ensuring that new development isn’t entirely upscale and out of reach for people of average means. But it’s just one tool in the affordable-housing planner’s proverbial toolkit. One of the most effective tools of all — in Vermont and everywhere else — would take the form of substantially bigger public appropriations for housing subsidies.

subdivision

Do you suppose we’ll be hearing anything about that, or about how to address the affordable housing crisis, in the coming presidential campaign? Don’t all speak at once.


New Jersey’s inspiration

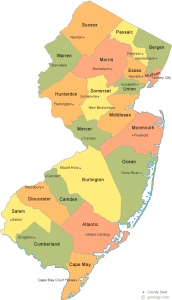
People in these parts can often be heard mocking New Jersey as some sort of cultural and environmental antithesis to Vermont. But they should be aware that New Jersey gave rise to a landmark civil rights doctrine – in housing – that resonates here.
new-jersey-county-map

That’s the so-called Mount Laurel Doctrine, as set out in two New Jersey Supreme Court rulings in 1975 and 1983, banning economic discrimination against the poor by municipalities in their land-use and zoning decisions. The rulings came after members of the black community in Burlington County’s Mount Laurel Township sued over a housing development plan that would have uprooted them in favor of middle-class and upper-middle-class families. (The town’s zoning effectively mandated homes that low-income families could not afford.)

The Fair Share Housing Center, which was among the litigants, has called Mount Laurel “one of the most significant civil rights cases in the United States since Brown v. Board of Education.” That might sound like a self-serving characterization, and of course, the rulings applied only to New Jersey, but the court’s reasoning echoes across the country. The court pointed out in its 1975 ruling that zoning regulations, “like any police power” exercised by a public entity, must promote general welfare. The decision went on to say:

“It is plain beyond dispute that proper provision for adequate housing of all categories of people is certainly an absolute essential in promotion of the general welfare required in all local land use regulation. Further the universal and constant need for such housing is so important and of such broad public interest that the general welfare which developing municipalities like Mount Laurel must consider extends beyond their boundaries and cannot be parochially confined to the claimed good of that particular community. It has to follow that, broadly speaking, the presumptive obligation arises for each municipality affirmatively to plan and provide, by its land use regulations, the reasonable opportunity for an appropriate variety and choice of housing, including, of course, low and moderate cost housing, to meet the needs, desires and resources of all categories of people who may desire to live within its boundaries.”

jerseycity

The court declared that Mount Laurel “must permit multi-family housing, without bedroom or similar restrictions, as well as small dwellings on very small lots, low cost housing of other types, and, in general, high density zoning, without artificial and unjustifiable minimum requirements as to lot size, building size and the like…”

More than 60,000 affordable units have been built in New Jersey as a result of the Mount Laurel decisions. That’s nowhere near the need, and there has been plenty of pushback, which continues to this day.

Nevertheless, the principle – that land-use regulations must accommodate people of all incomes – has been adopted by other states, including Vermont. Vermont’s zoning statute states, among other things, that:

“No bylaw nor its application by an appropriate municipal panel under this chapter shall have the effect of excluding housing that meets the needs of the population as determined in the housing element of its municipal plan as required…”

Among those requirements is “addressing low and moderate income persons’ housing needs.”

Cayuga’s waters trickle down

When it comes to fair housing, Burlington might be able to learn something from Ithaca. Ithaca issued its “Analysis of Impediments to Fair Housing Choice” in May; Burlington’s most recent AI came out in October 2010, so it’s a bit dated.

Ithaca has about 10,000 fewer people, but the two cities have a few things in common – among them, the university/college presence and predominantly white populations. What’s more, they both happen to be listed in somebody’s “17 Best U.S. Cities for Hippies.”

ithacaoverview

Here are some of the Ithaca findings that might raise parallel questions in Burlington:

  • “People with disabilities report higher levels of discrimination and lower levels of housing accommodation than other residents.”

This appears to be the case in Vermont generally, judging from Human Rights Commission reports, but the extent to which it might be true in Burlington is worth a look.

  • “The City of Ithaca does not currently have a Language Assistance Plan, nor is the need for one mentioned in its 2013 Limited English Proficiency Plan.”

Ithaca’s largest minority population is Asian, and four of the seven languages for which translation services are most needed are Asian. Burlington appears to have a more diverse population of refugees, but the question of how Burlington handles assorted language needs is worth asking. After all, as the Ithaca report notes, “Title VI of the Civil Rights Act of 1964 requires that federal assistance recipients provide language assistance to individuals with limited English proficiency.”

  • “The obligation of sub-recipients of City Community Development Block Grant/HOME funds to Affirmatively Further Fair Housing (AFFH) is not effectively communicated by the City nor understood by its sub-recipients.”

Well! Dare we suggest that AFFH is not terribly well understood in these parts, either?

  • “Exclusionary tactics against households who rely on public and private subsidies for housing is prevalent in the City and has a disparate impact on protected classes in Ithaca.”

The report notes that 15 percent of the county’s residents have disabilities, but 40 percent of Housing Choice Voucher recipients (Section 8) have disabilities. Similarly, African Americans comprise 6.5 percent of the county population but 20 percent of the Section 8 population. Fair housing testing showed that discrimination against voucher holders was widespread.

Now in Vermont, housing discrimination against people on public assistance is illegal. How commonly the state’s fair housing law is violated remains an open question, though. What share of Burlington’s Section 8 population is disabled or minority, and how do these people fare in the rental market? Perhaps the city’s next fair housing assessment will address these questions.


Vermont’s housing affordability gap, by county

burlingtonhouse

A couple of years ago, the Urban Institute came out with a study, “The Housing Affordability Gap for Extremely Low Income Renters in 2013.” The takeaway conclusion: Nationwide, there were just 28 “adequate and affordable” units available for every 100 renter households with incomes at or below 30 percent of the area median.

The paper listed, among other things, populous counties with the biggest affordability gaps – that is, the counties with the fewest affordable housing units for every 100 low-income households. At the bottom was Denton, Texas, with only 8 affordable units for every 100 renters. (At the other extreme, Suffolk County in Massachusetts had the smallest affordability gap, with about 50 units for every 100 renters.

We decided to look at the affordability gap in Vermont, comparing the state’s 14 counties using statistics drawn from Vermont Housing Data. The measure isn’t quite the same as the one used by the Urban Institute, but it shows a wide ranging disparity across the state nevertheless.

County Pop. Below pov. (2009-13) Below pov./pop. Subsidized units Subsidized units per 100 people in poverty
Addison 36,821 3,875 11% 499 12.88
Bennington 37,125 4,900 13% 808 16.49
Caledonia 31,227 4,236 14% 548 12.94
Chittenden 156,545 16,672 11% 4,644 27.86
Essex 6,306 995 16% 77 7.74
Franklin 47,746 4,837 10% 761 15.73
Grand Isle 6,970 481 7% 69 14.35
Lamoille 24,475 3,021 12% 358 11.85
Orange 28,936 3,701 13% 399 10.78
Orleans 27,231 4,047 15% 324 8.01
Rutland 61,642 7,655 12% 1,341 17.52
Washington 59,534 5,439 9% 1,232 22.65
Windham 44,513 5,306 12% 1,231 23.20
Windsor 56,670 5,708 10% 1,164 20.39
Vermont 625,741 70,873 11% 13,445 18.97

Here are two key numbers to look at: The number of people below the poverty level in each county; and the number of subsidized housing units in each county per 100 impoverished people.

As you might expect, there’s not enough subsidized housing in any county to accommodate low-income people. But beyond that, it’s noteworthy that the affordability gap is biggest in the two counties with the highest poverty rates (Essex, Orleans) and smallest in the county with the lowest poverty rate. In other words, affordable housing is even scarcer in the poorest counties than in the richest.


Beyond the ADA

The 25th anniversary of the Americans with Disabilities Act is getting deserved public attention. Still it’s worth mentioning that disabilities were added to the Fair Housing Act in 1988, two years before the ADA’s passage. That is, housing discrimination toward people with disabilities became illegal even before the rights of disabled people were established in employment and public accommodations.


Empty wheelchair on the pier in the harbor

As we mentioned in a previous post, of all the protected classes under the Fair Housing Act, disability is the leading source of discrimination complaints, both nationally and in Vermont.

People with disabilities are more likely to draw lower incomes. So hypothetically, it could be argued housing policies that adversely affect people with disabilities might have a disparate impact on poor people more generally.

Here are some Vermont numbers to chew on, from the Vermont Housing Data site:


County

Pop.

% disabled

Below pov. (07-11)

Median fam. income

Below pov./pop.

Addison

36,821

13

3,875

69,157

11%

Bennington

37,125

16

4,900

61,270

13%

Caledonia

31,227

18

4,236

54,941

14%

Chittenden

156,545

10

16,672

83,887

11%

Essex

6,306

19

995

45,000

16%

Franklin

47,746

14

4,837

68,408

10%

Grand Isle

6,970

12

481

69,722

7%

Lamoille

24,475

11

3,021

64,500

12%

Orange

28,936

15

3,701

63,253

13%

Orleans

27,231

16

4,047

52,235

15%

Rutland

61,642

15

7,655

61,516

12%

Washington

59,534

11

5,439

70,640

9%

Windham

44,513

16

5,306

63,509

12%

Windsor

56,670

16

5,708

70,467

10%

Burlington MSA

211,261

11

21,990

79,068

10%

Vermont

625,741

13

67,761

70,873

11%

Higher disability rates tend to be correlated with lower median incomes. For example, Chittenden County is on the high end for median family income, and Essex County, at the low end; and the they have the lowest and highest proportions of disabled people, respectively.