Category Archives: Uncategorized

Hey, what about us backwaters?

We’ve mentioned before that much of the literature on affordable housing and affirmatively furthering fair housing focuses on major metropolitan areas and their urban demographics. We’re not immune to all those gnarly issues here in Vermont, but we can’t help but wish for more analysis with a rural focus.

Help may be on the way from HUD, via its Affirmatively Furthering Fair Housing Tool, which promises to provide maps, housing and demographic data for jurisdictions in all parts of the country, including the rural ones. We say “promises” because we can’t seem to get the tool, which is still in development but available for interim inspection, to work for Burlington or the rest of Vermont — the two jurisdictional options. The mapping tool does work on our desktop for New Hampshire and Maine, so it’s possible to get an idea of what sorts of data plots we’ll be able to see for Vermont one of these days.

You can try your luck by clicking here. Then click OK, choose one of the 12 maps you’d like to see (e.g., race/ethnicity, housing choice vouchers, demographics and transportation, etc.), then the state and jurisdiction. If you can get it to work for Vermont, great; if not, choose another place just to get an idea.

When this system is fully functional, it will be accessible to anyone and perhaps will spare HUD grantees the expense of hiring consultants to do the requisite fair-housing analysis.

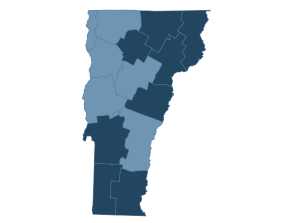
Meanwhile, rural places like Vermont do have another helpful data source, the Housing Assistance Council, which provides interactive maps with data on the state and county level. Here’s what the Vermont map looks like:

www_ruraldataportal

The darker counties have higher poverty rates. We don’t know how to make the map interactive on this blog, so click here to explore it on the Council’s website. You can click on each county for a wealth of data. You’ll notice that the rural percentage of each county’s population is listed – 100 percent, in most cases, 0 percent in Chittenden County, our very own megalopolis.
 

Highlights from fair housing conference

Here’s Fritz Mondale, former VP and co-sponsor of the Fair Housing Act, speaking yesterday about what it took to get the bill through Congress. Among other things, it required support from “Lincoln Republicans” and a nudge from President Johnson.

The venue was HUD’s National Fair Housing Conference, in Washington, for which Mondale was the keynoter.

//

And here’s Richard Rothstein, of the Economic Policy Institute, debunking the national myth of “de facto segregation” — and explaining how residential racial segregation has been a result of conscious public policy on the part of federal, state and local governments.

http://

Show me a micocosm

If you never had the time or inclination to read Thomas Piketty’s “Capital in the 21st Century,” you could still learn a good deal about economic inequality simply by reading the reviews.

Similarly, if you haven’t seen the six-part TV series “Show Me a Hero,” which concluded recently on HBO, you can still learn a little something about affordable housing just by skimming the reviews. (Disclosure: We haven’t read Piketty in full or watched “Show Me.”)

The series – co-written by David Simon (of “The Wire,” which we have seen and can recommend) — depicts a political struggle in Yonkers during the ‘80s. The “Show Me” story resonates today with a plot-line driven by a maverick political leader and opposition to affordable housing that’s evocative of recent attacks on HUD’s affirmatively furthering fair housing rule.

showme

You can get a pretty good sense of the show, and its topical currency, in this treatment in the Washington Post, or in this one in the Guardian.

And lest you think the contesting attitudes and political battles are limited to the metropolis, think again. What the current director of public housing in Yonkers says , in this Slate interview, is true all over.

“There is always community resistance to affordable housing,” Joseph Shuldiner says. “People believe that affordable housing will bring down the value of their property and bring in people who are not desirable. I don’t think in most cases that’s proven to be the case. “

And he captures the dilemma of where to invest limited public resources:

“We really need to maximize the number of viable communities with affordable-housing opportunities. That means both getting affordable housing into already viable communities but it also means making the poverty concentrated areas viable so they will attract other-than low-income people.”


Tale of two cities

Consider Burlington times three. That’s Ann Arbor, sort of.

annarbor1

Ann Arbor, like Burlington, has a big student population and a big housing-affordability problem. But now all of a sudden, seemingly, it has something else that Burlington doesn’t: a rental housing glut. Thanks to a profusion of new housing, both on-campus and off, the vacancy rate is up, empty apartments are going begging at the start of another academic year, and some rents are coming down.

Let’s pause here to run the numbers: Ann Arbor’s population is 117,000; the University of Michigan’s enrollment is 43,625, or about 37 percent.

Burlington’s population is about 42,300; UVM’s enrollment is about 12,700, Champlain College’s about 2,000. So, students here comprise around 35 percent.

Ann Arbor’s rents look to be roughly in Burlington’s range. An older, four-bedroom home rents for $2,800, or $700 per bedroom, according to the Ann Arbor News.

Before the surplus in rental housing became apparent, Ann Arbor officials were talking about how to address the affordability problem. The idea of rent control was floated – as it is occasionally in Burlington – but remains impossible without legislative authorization. As things stand, thanks to a 1988 state law, Michigan’s towns and cities can’t do anything to control rent. That means inclusionary zoning is banned, too. Burlington at least has that.

How many of Ann Arbor’s new high-rise rental units are affordable? Probably very few – developers seemingly have no financial incentive to provide any. The good news, for renters, is that some rents are dropping because of all the housing that’s been built (including graduate-student housing by the university). That’s what officials in Burlington like to imagine happening here, too: more student housing plus more private housing development alleviating the upward pressure on rents.

Sounds promising, but Ann Arbor has paid what some might consider an unsightly price: a surfeit of luxury high-rises downtown:

annarbordowntown

Here a subsidy, there a subsidy


Housing subsidies diminish income inequality, while the mortgage-interest deduction, together with the real-estate-tax deduction, has the opposite effect.

mansion1

This makes intuitive sense: housing subsidies disproportionately benefit low-income people, and mortgage-interest/real-estate deductions, the well-to-do. We don’t need a study from the Urban Institute to convince us of that. “Housing Tax and Transfer Programs Decrease Inequality” goes further, though: it says that the equalizing effects of housing subsidies outweigh the disequalizing impact of the tax benefits.

There’s not much comfort in that, however. Only about one in four eligible families gets federal housing assistance. Low-income housing subsidies, totaling about $36 billion in rental vouchers, are less than half the combined total of mortgage-interest ($70 billion) and real-estate-tax ($28 billion) deductions.

Still, housing subsidies and housing tax breaks deserve to be mentioned in the same breath, as part of the same policy conversation. Members of Congress who support cuts in housing subsidies don’t necessarily go along with eliminating the mortgage-interest deduction – although getting rid of that deduction has periodically gained support variously as a form of tax-code simplification or as tax fairness.


Familiar struggles to the south

 Fresh off yesterday’s post on single-family zoning comes this news out of Louisville: a proposal to allow developers to build multi-family housing in single-family zoned districts. Developers would also get to build denser projects if a percentage of the units are affordable – a variant of inclusionary zoning.

louisville

But alas, density bonuses aren’t enough, as this editorial out of Charlotte, N.C., makes clear. They resulted in zero affordable units from private developers in that city over the last couple of years, so other planning tools are needed to meet the massive affordable housing gap in that city.

Ostensibly these big cities to the south have little in common with any place in Vermont, but it’s worth noting that they’re both struggling with the same overall problem we face here – an acute affordable housing shortage – and that there are no silver bullets. It’s a complexity that requires a mix of policies to alleviate.


Affordable housing’s carbon footprint

Affordable housing, when it’s located near town centers or transit hubs, benefits not just its residents but the larger community. That’s because inclusive, diverse communities tend to enjoy more economic, social and cultural vitality that their exclusive counterparts. But there’s another argument for building more of this housing – which typically takes the form of multifamily, subsidized housing — in “locationally efficient” places: as part of a climate-change strategy mitigating greenhouse gas emissions.

greenhousemorgue1

Lower-income people drive less and use space more efficiently than non-low-income households. Therefore, a multi-unit complex occupied by lower income people is likely to produce lower levels of greenhouse gas emissions than a luxury complex with the same number of people.

So we learn from a new study for the California Housing Partnership, “Income, Location Efficiency and VMT.” VMT stands for vehicle miles traveled, the standard measure that climate-change plans try to reduce. The study, based on California data, concludes that “allocating land and funding to enable development of location-efficient areas in a way that is affordable to lower-income households is expected to yield greater VMT benefits per parcel and per person than allocating the same land to higher-income people.” After all, lower-income people not only drive less, they “own fewer cars, live in fewer rooms, and take up smaller shares of their buildings.” What’s more, they disproportionately prefer to live in location-efficient areas, the study says, further justifying the housing subsidies.

singlefamily

This study complements the literature that takes suburban sprawl and the single-family home to task as unsustainable. The per person carbon footprint of the residential multi-unit complex is less than for the tract home, as a piece in the Atlantic several years ago pointed out. Some of the anti-single-family screeds can be pretty shrill, like this one out of Seattle — a city where the administration even toyed with the heretical idea of banning single-family zoning.


The finer points of rent inflation

This may come as a shock, but when it comes to development of multi-family rental housing, new luxury units far outnumber the mid-tier ones across the country. Little wonder, when they’re built on a scale like this:

miamitower

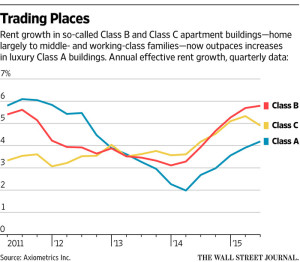
And because of the abundance of luxury units, luxury rentals are rising less rapidly than mid-tier rentals.

So says a recent piece in the Wall Street Journal, which featured this graph on rent inflation that makes the point. Class A is luxury, Class B & C are for middle-income and working-class people:

rentclassgraph

Whether this sort of thing is going on in Vermont is up for discussion. We can’t say for sure. Anecdotally, though, we notice that rents in new mid-tier buildings – never mind the luxury ones – are getting rather pricey.

There’s a new apartment building on South Winooski Avenue in Burlington, for example, where a one bedroom runs $1,350 and a two bedroom, $1,625. Those rates look to be above average, although of course the average is forever rising.

Then there’s a new high-rise complex in Williston where a one bedroom goes for $1,425 and two-bedroom for $1,825.

Both of these places have apartments that are above HUD’s 2015 fair market rents, so they’re off-limits to Section 8 voucher holders.

By the way, HUD’s fair market rents are the same for Burlington, Williston, South Burlington, Winooski, and so on. How do they compare to averages in these places? You be the judge:

1 BR, $1,003; 2 BR, $1,309; 3 BR, $1,639; 4 BR, $1,925.


Spurning another national trend

New population estimates have revealed a startling trend, as described in this blog post on the Harvard Joint Center for Housing Studies website: urban cores growing faster than suburban fringes. Nationally, city populations were up 0.91 percent on average in 2010-14, compared to 0.77 for the suburbs.

“This recent trend of city populations growing faster than those of suburbs is a dramatic departure from prior decades, when suburban population growth significantly outpaced that of cities,” writes Rachel Bogardus Drew, a post-doctoral fellow.

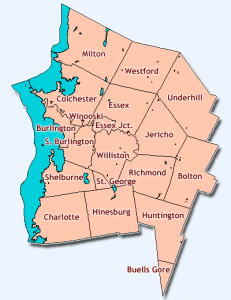
Naturally, this set us to wondering about Vermont’s own megalopolis. Not surprisingly, especially in a state that likes to think of itself as idiosyncratic, the trend doesn’t hold here. If anything, it’s operating in reverse: suburbs here are still outgrowing the urban core of Burlington and Winooski.

chittco

Before getting carried away with this, we remind ourselves that the latest estimates are just that, and the Vermont-scale numbers are so small that errors could easily swing some totals the other way.

Still, we can’t help but notice that the populations of Burlington and Winooski are both down, and those of all the other Chittenden County towns, save Westford, are up:


       2010 census        2009-13 estimate
Bolton town 1182 1204
Buels gore 30 46
Burlington city 42417 42331
Charlotte town 3754 3776
Colchester town 17067 17167
Essex town 19587 19908
Hinesburg town 4396 4427
Huntington town 1938 1965
Jericho town 5009 5021
Milton town 10352 10429
Richmond town 4081 4086
St. George town 674 728
Shelburne town 7144 7332
South Burlington city 17904 18163
Underhill town 3016 3030
Westford town 2029 1947
Williston town 8698 8820
Winooski city 7267 7257


Let’s face it, though, the rises and falls are pretty small, in most cases – further evidence of Vermont’s much-lamented population stagnancy, or graying, as the Millennials flee and the old-timers hang-on. Could it be that some of the Millennials are leaving because they can’t afford to live here?


The renter minority

Yesterday’s post took note of the housing burden borne by Burlington’s renters (they pay 44 percent of their income, on average, on rent/utilities). Demographically, that’s a significant burden, because renters in this city are the majority.

In a state where the home ownership rate is over 70 percent, about 9 points above the national average, not many other municipalities can make that claim. Only one other can, in fact: Winooski.

According to the Vermont Housing Data website, 62.2 percent of Winooski’s residents who live in occupied units are renters. In Burlington, the figure is 57 percent.

burlingtonapt2

These are the only communities in the state where the renter population outnumbers homeowners. The renter-occupant figure for Vermont as a whole is 25.9 percent.

Conscientious readers may recall that Winooski scored No. 1 on the workforce housing index we introduced last month. In case you missed it, that index showed the number of subsidized housing units for every 100 in Vermont’s major employment centers. (We defined major employment centers as municipalities with 2,000 jobs or more in 2014.) Burlington came in at No. 5.

As it happens, several other employment centers that do a relatively good job of providing affordable housing also have big renter populations.

apartment

Barre City’s renter population is 48.5 percent; Rutland City’s, 42.7 percent; Brattleboro’s, 43.2 percent; St. Albans City’s, 46.9 percent; and St. Johnsbury’s, 40 percent.

Of the big suburbs surrounding Burlington/Winooski, South Burlington has the highest renter proportion (30.8 percent). The others are all below the state average: Colchester, 25.8 percent; Essex, 20.6 percent; Shelburne, 17.3 percent; and Williston, 14.9 percent. (All of these communities are “major employment centers,” by the way.)

When people talk about the need for affordable housing in Vermont, they’re talking mostly about multi-family housing for renters (although, yes, efforts to promote accessory rental units, as well as single-family homes/condos for purchase, are important). So, here are a few things to keep in mind about renters in Vermont generally, as compared to homeowners:

  • The median household income for a Vermont renter household ($30,943) is less than half that for the homeowner household ( $64,771).
  • The housing cost burden falls more heavily on renters. Among renters:

— 52.5 percent pay more than 30 percent of their household income on housing, as compared to 32 percent of owners;

–26.4 percent pay more than half their household income on housing, as compared 12 percent of homeowners.